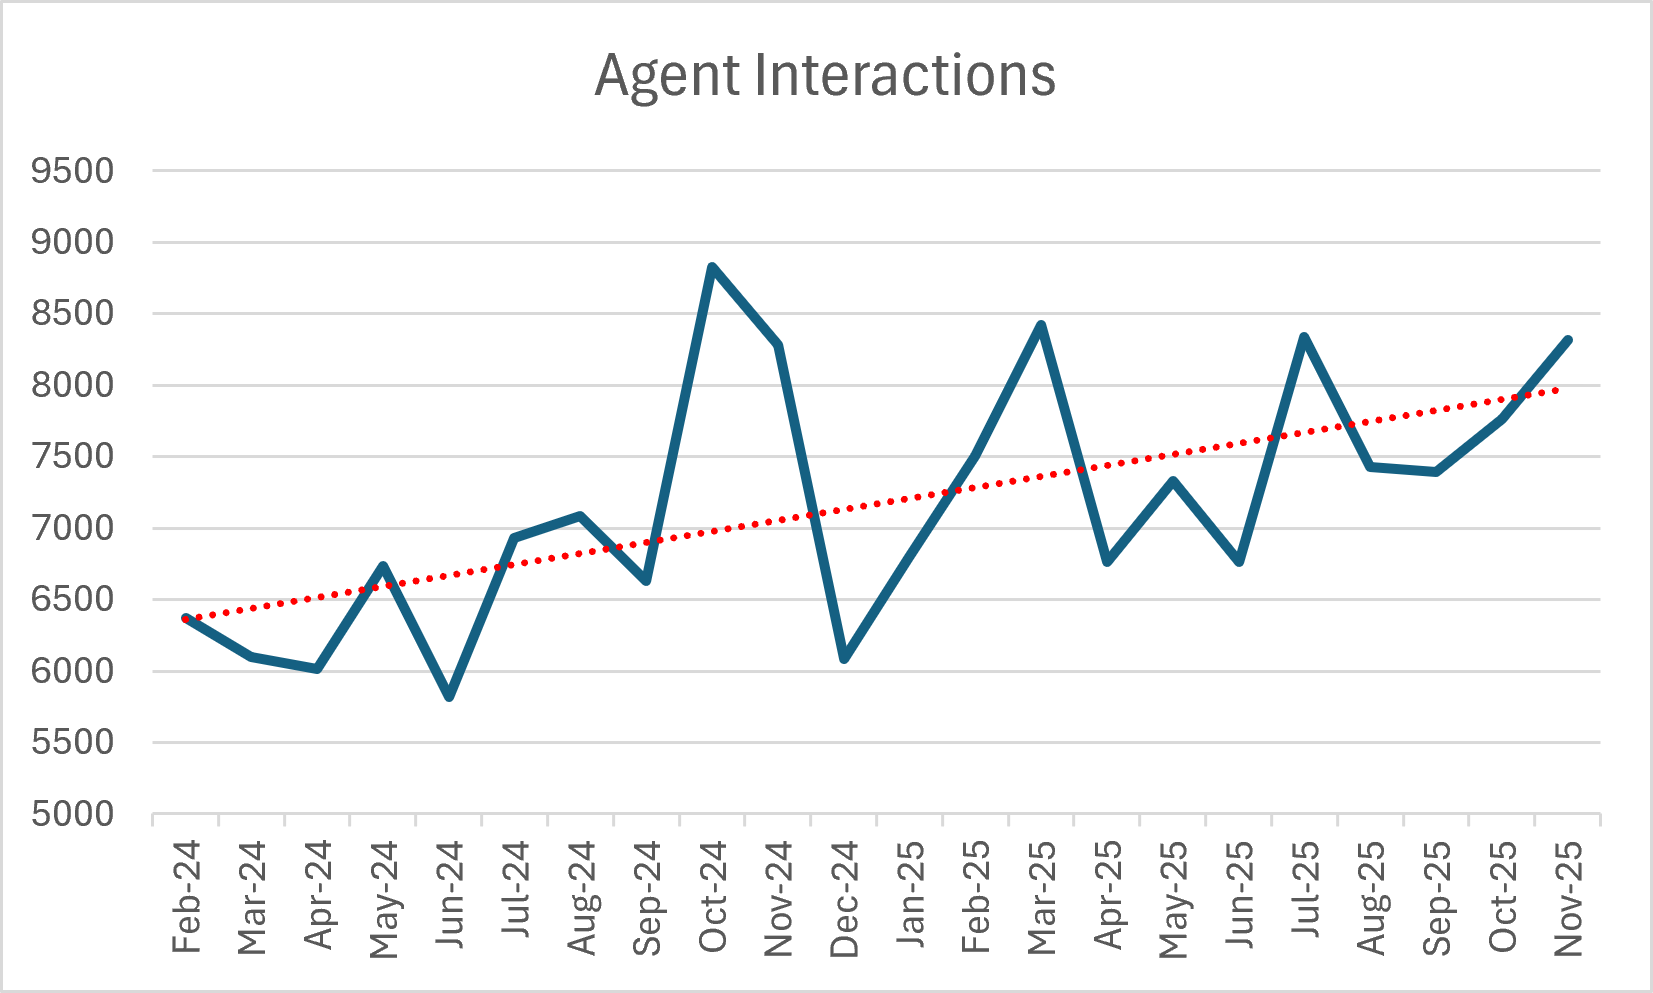
Agent Interactions - A trendline showing the volume of tickets updated by the Service Desk per month.
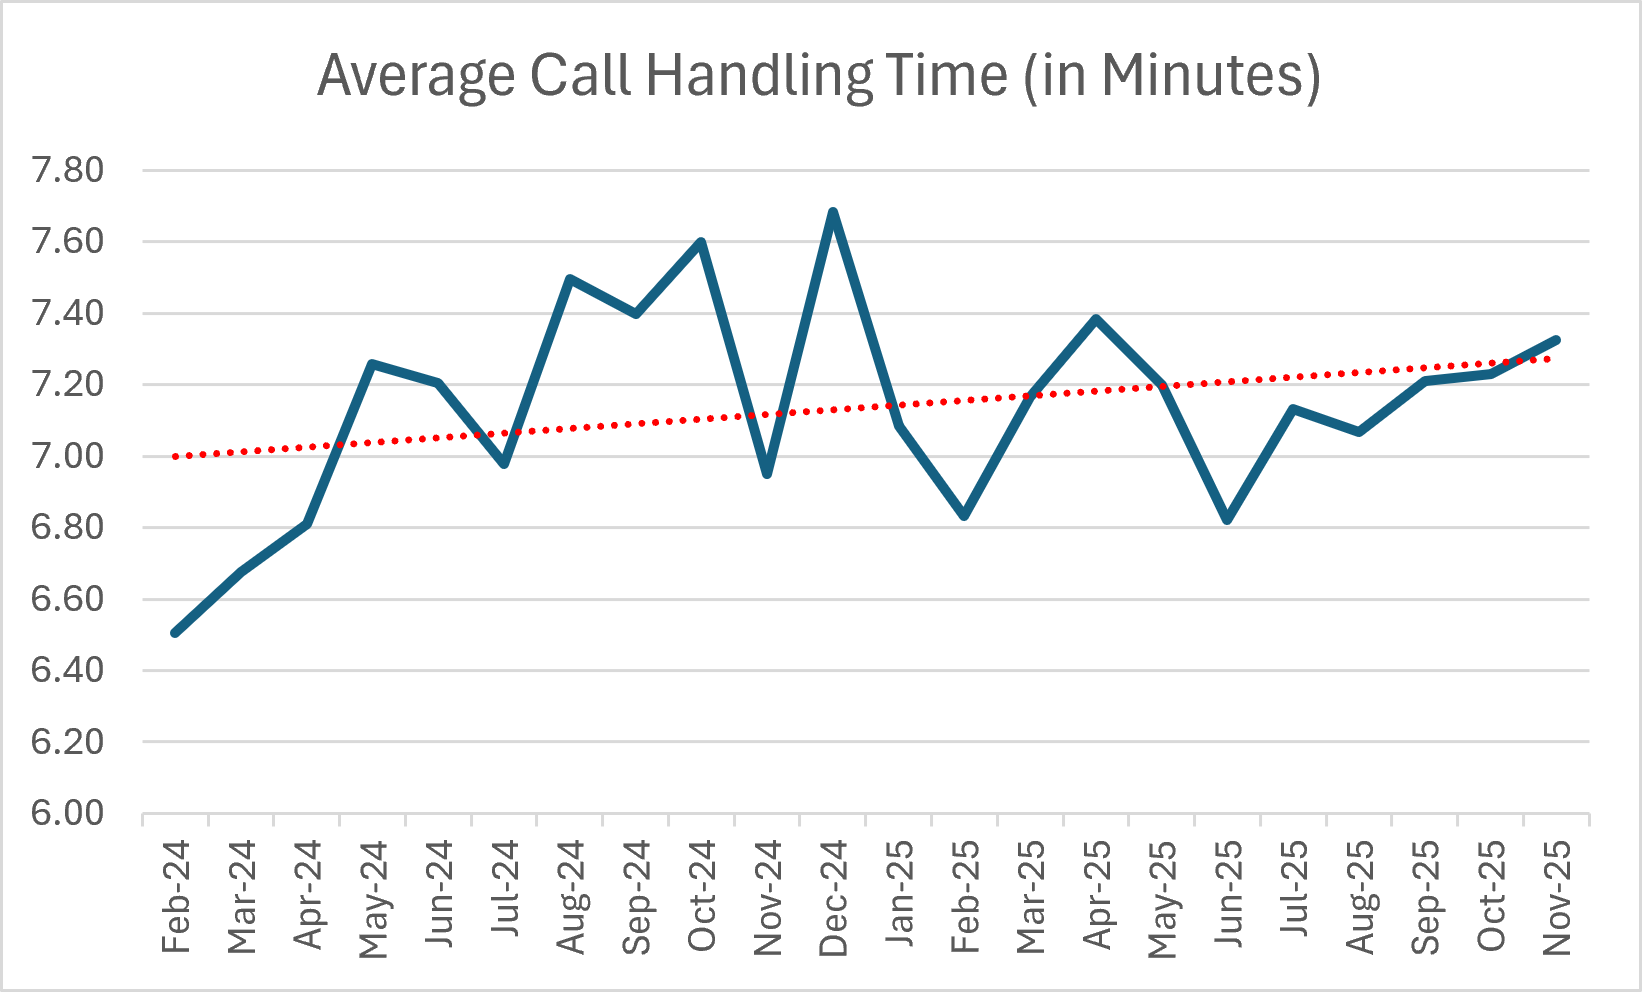
AHT - A trendline of the average handling time of calls taken by the Serivce Desk.
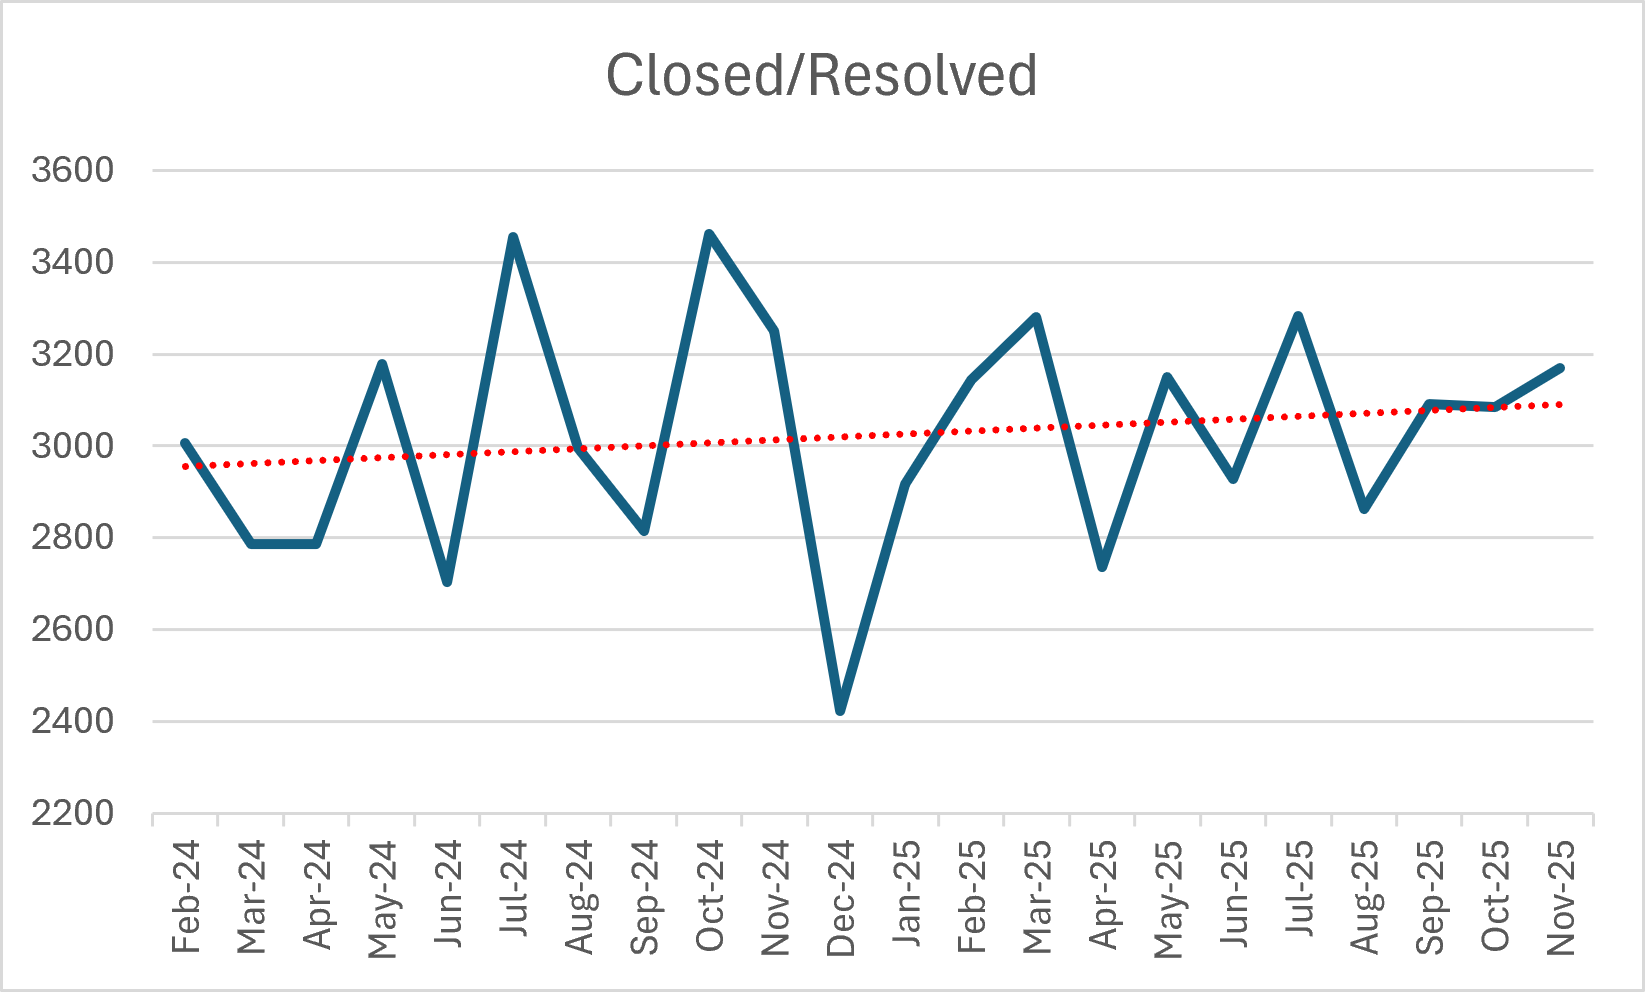
Closed/Resolved - A graph charting the volume of closed (requests) and resolved (incidents) tickets by month.
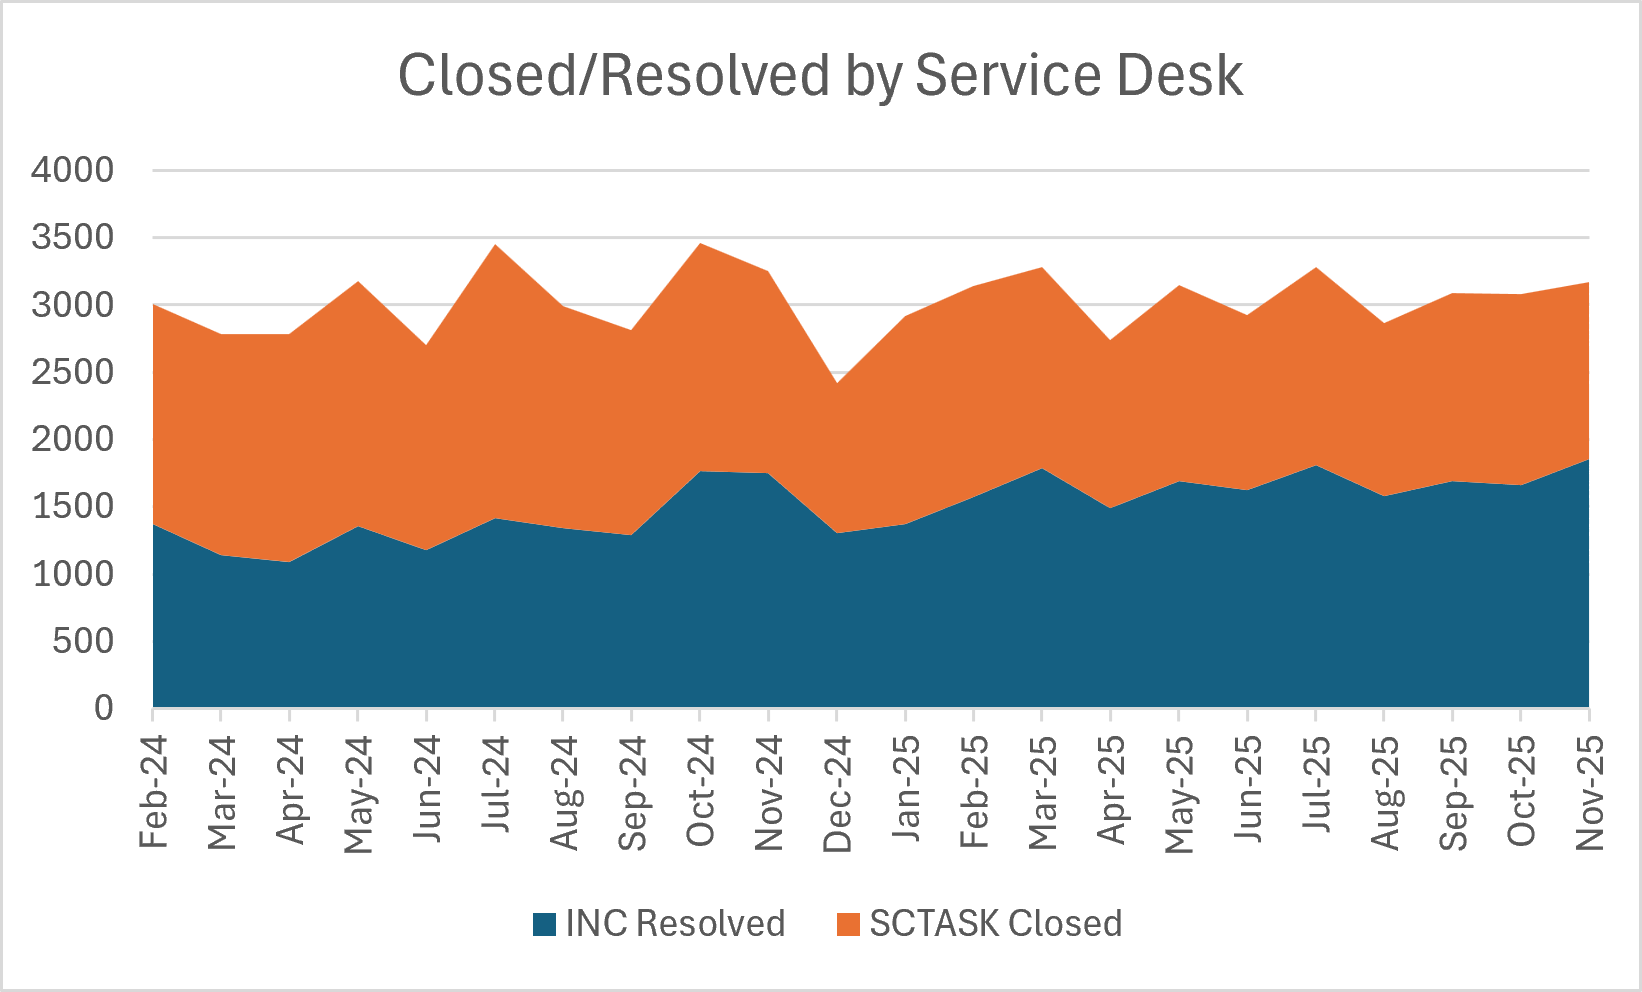
Closed/Resolved - A trendline charting the change in volume of closed (requests) and resolved (incidents) tickets by month.
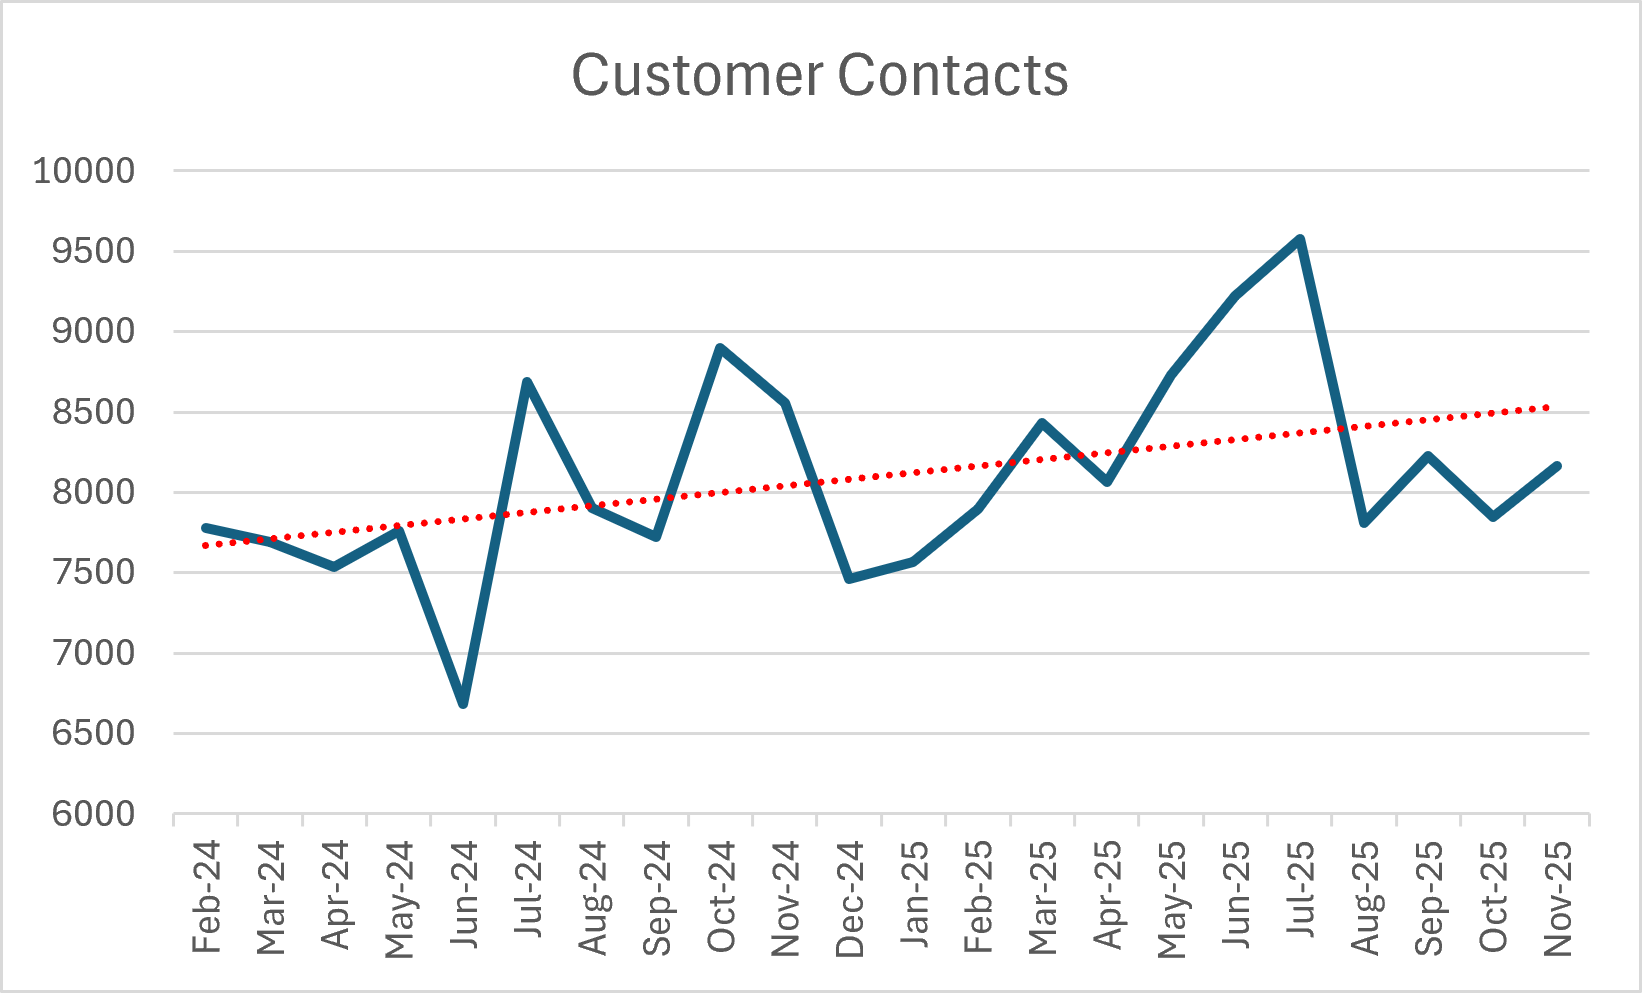
Customer Contacts - A graph to show the change in the volume of customer contacts being received each month.
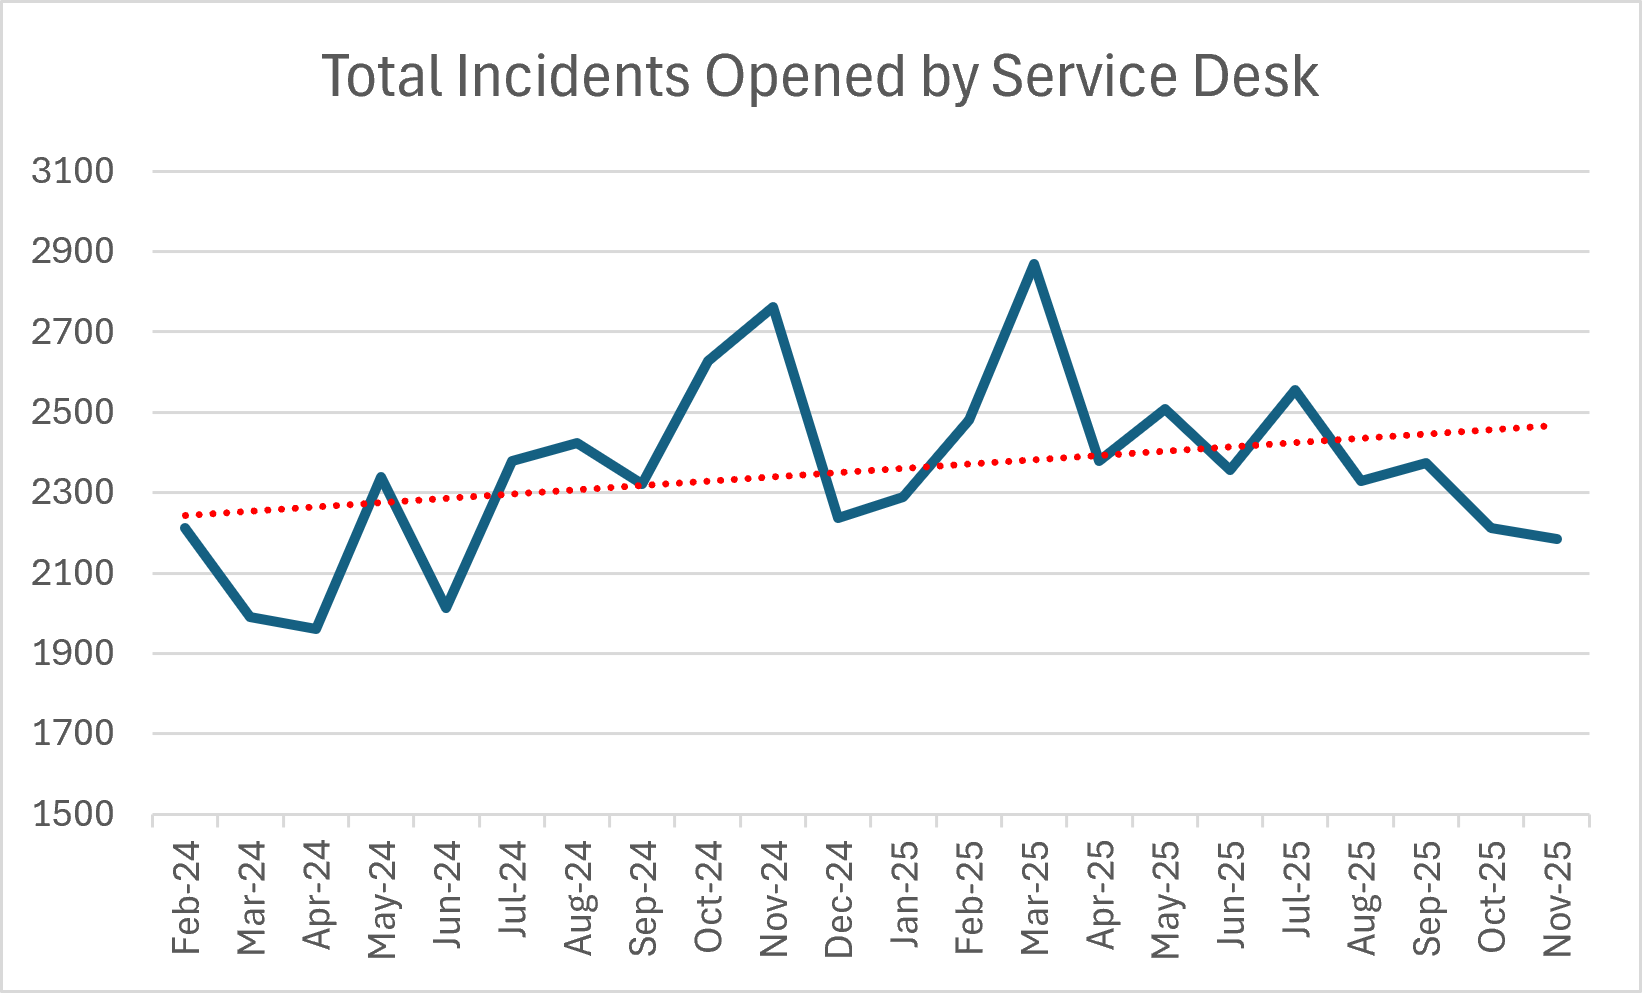
Incidents Opened - A trendline to show the change in volume of incidents being opened by month.
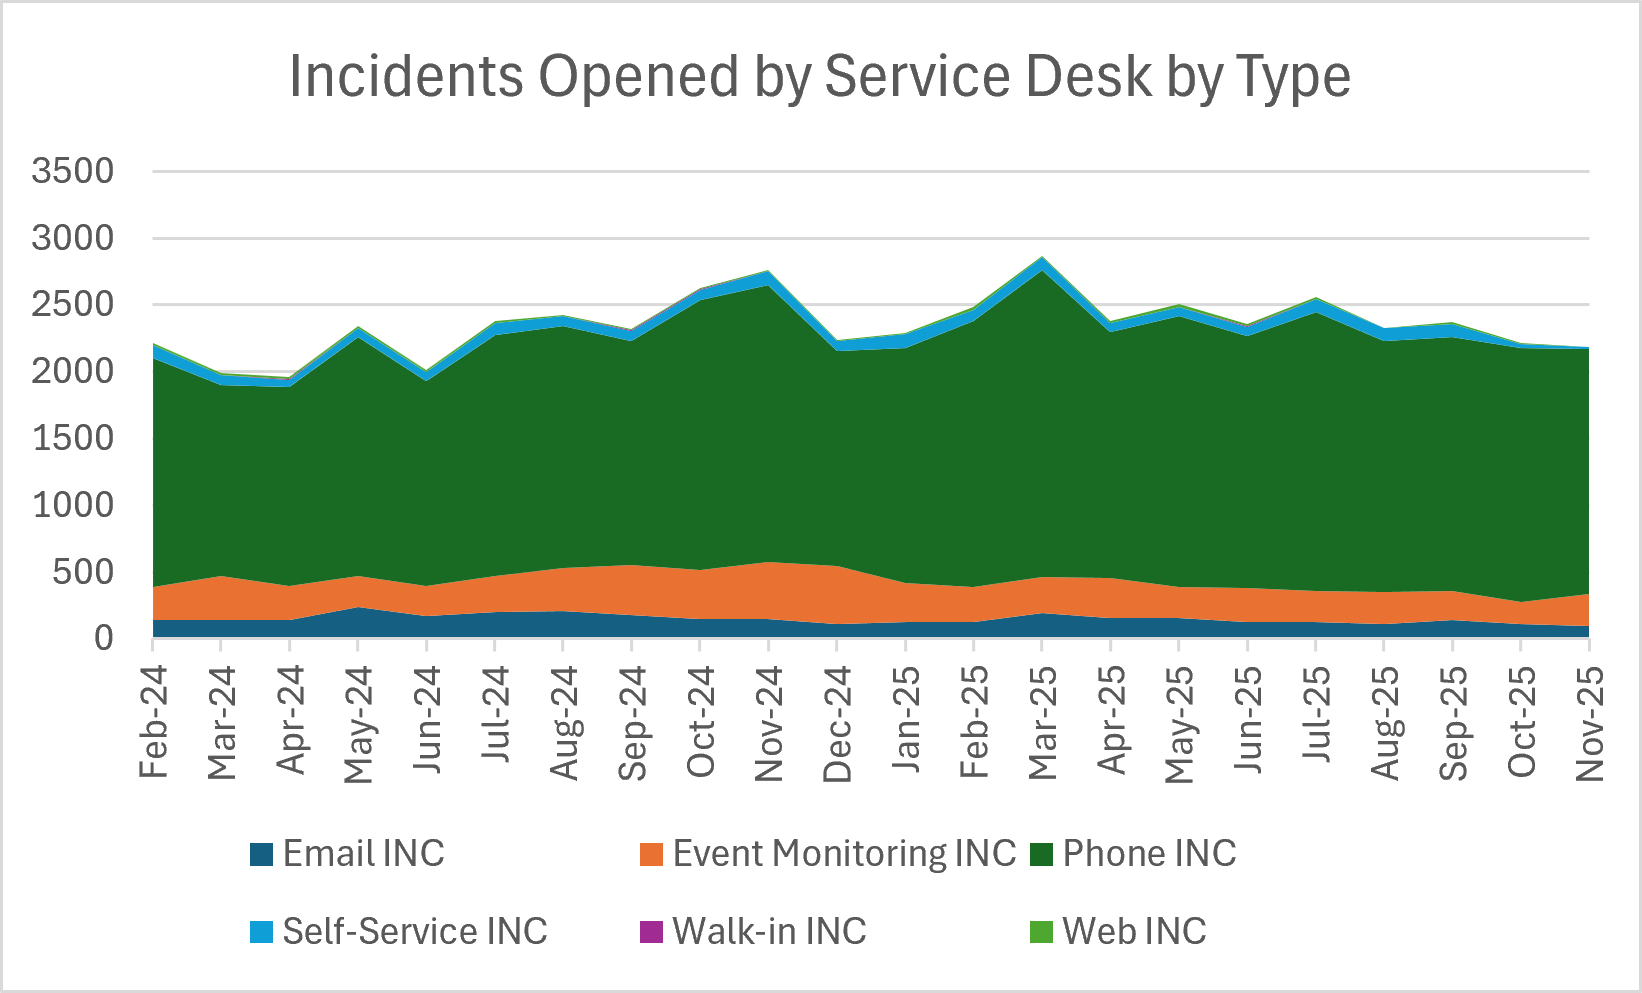
Incidents Opened - A graph to show a breakdown of the contact-types generating incidents.
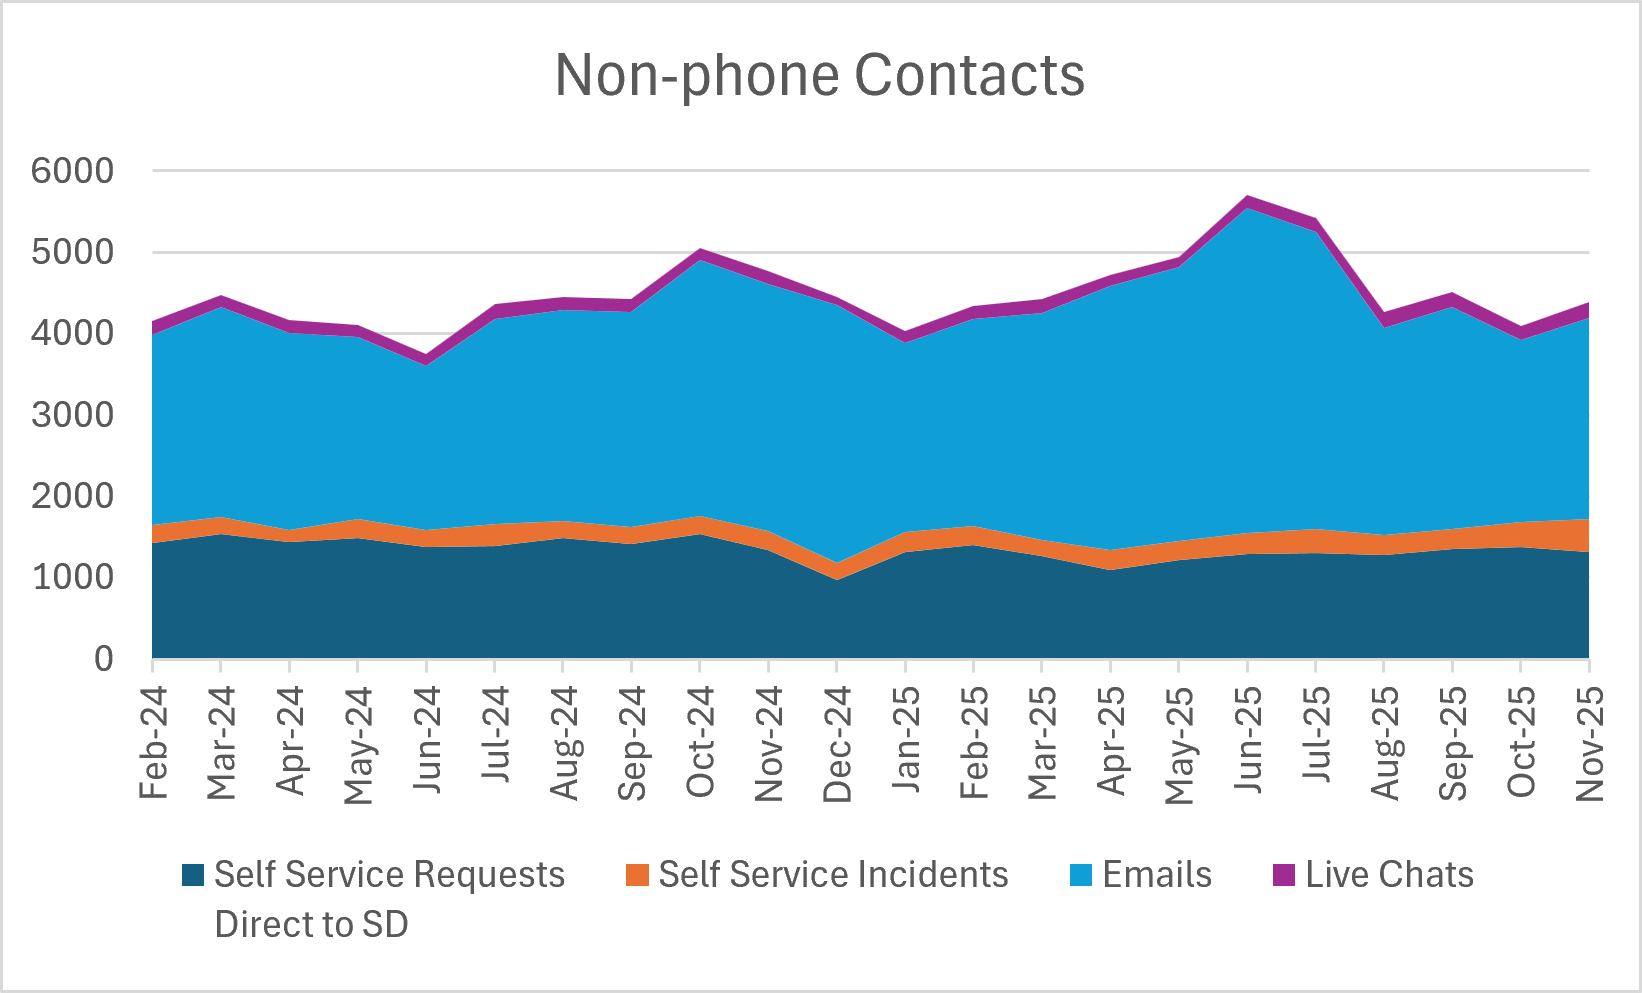
Non-Phone Contacts - A breakdown of all user contacts that were not calls.
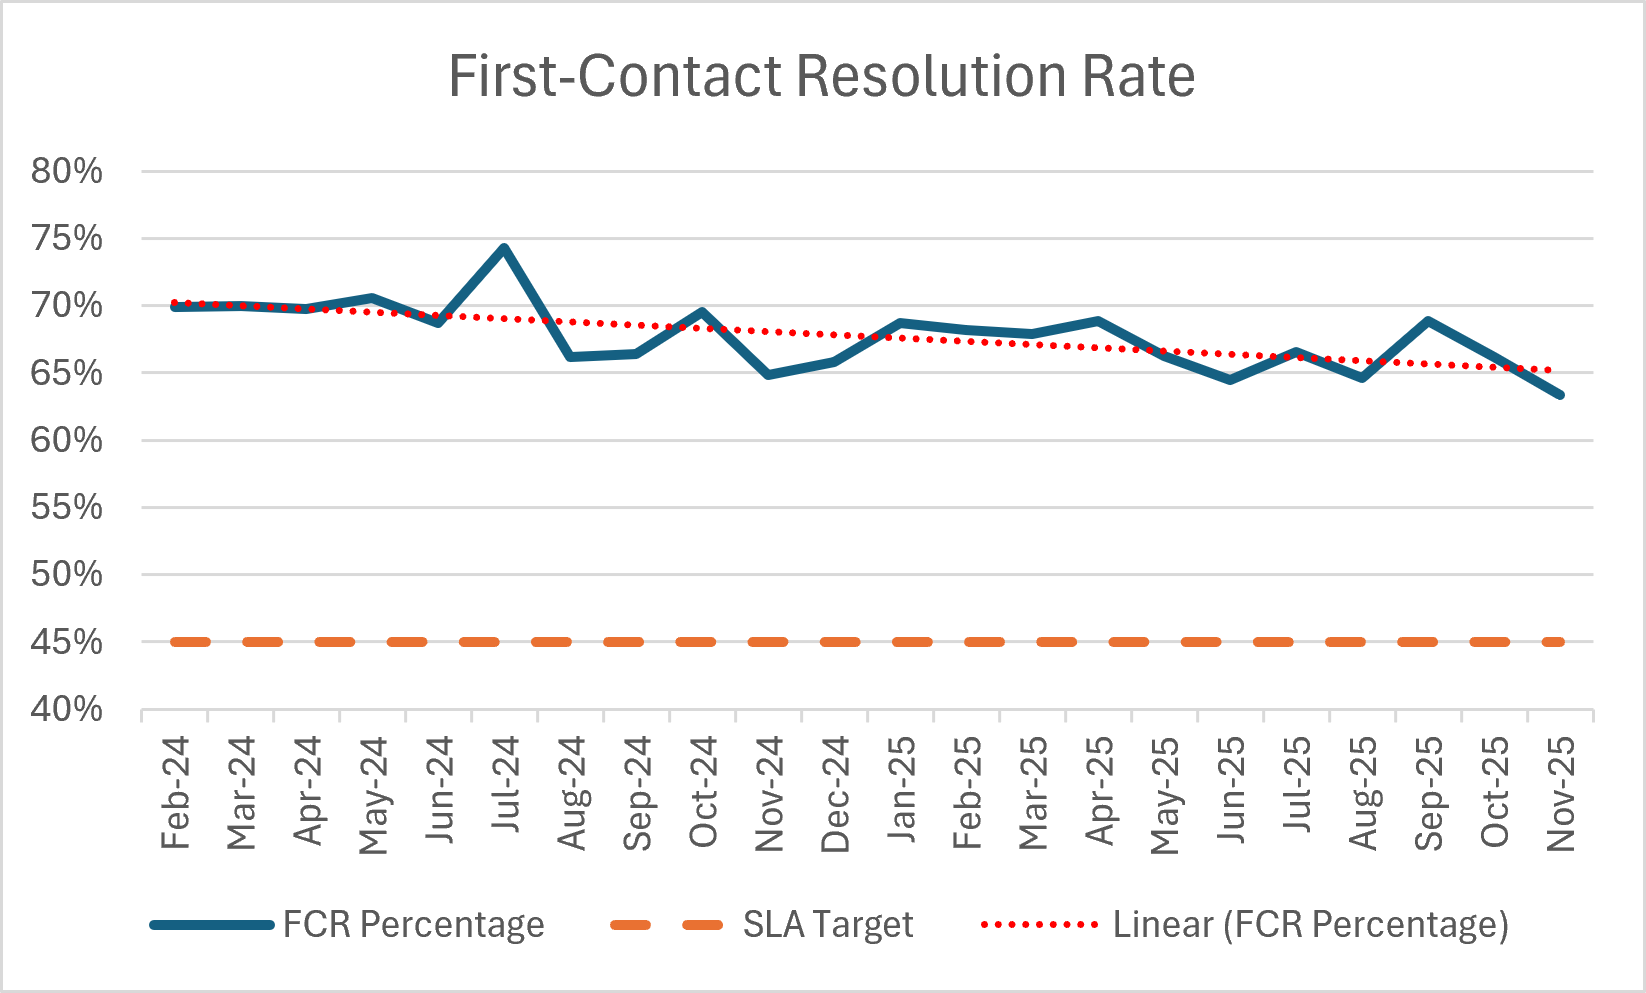
First Contact Resolution - A trend line showing the team's FCR rate against the SLA target.